

Nessa artigo, apresento algumas linhas de códigos para gerar um gráfico de correlações com ações do IBOV. O código para raspar os retornos das ações é o mesmo em Web Scraping de retornos de ações.
suppressMessages(library(ggplot2))
suppressMessages(library(httr))
suppressMessages(library(rvest))
suppressMessages(library(reshape2))
ticker <- read.csv("https://www.dropbox.com/s/2nfnj13jhnpk6na/IBOV.csv?dl=1",header=FALSE,sep=",")
data_inicial <- "14/04/2018"
data_final <- "08/05/2021"
# Web scraping
for(i in 1:nrow(ticker)){
url <- paste0("https://www.ibovx.com.br/historico-papeis-bovespa.aspx?papel=",unlist(ticker)[i],"&dtini=",data_inicial,"&dtfim=",data_final)
sh <- GET(url = url)
data <- read_html(sh) %>% html_nodes("div") %>% html_nodes("table") %>% html_nodes("tr") %>% html_nodes("td") %>% html_text()
data <- data[-grep("\r\n.ibovx_bannerresponsivoabaixomenu",data)] # remover banner entre as linhas da tabela
if(! length(data) == 0){
data <- matrix(data[13:length(data)],ncol=9,byrow=TRUE)
ret <- gsub("%","", data[-1,2])
ret <- na.omit(as.numeric(gsub(",",".",ret)))
ret <- matrix(ret, byrow = TRUE)
colnames(ret) <- unlist(ticker)[i]
attributes(ret)$na.action <- NULL
if(i == 1){
returnsT <- ret
}else{
if(nrow(ret) == nrow(returnsT)){
returnsT <- cbind(returnsT,ret)
}
}
}
pb = txtProgressBar(min = (1 / nrow(ticker)), max = nrow(ticker), style = 3)
setTxtProgressBar(pb,i)
}
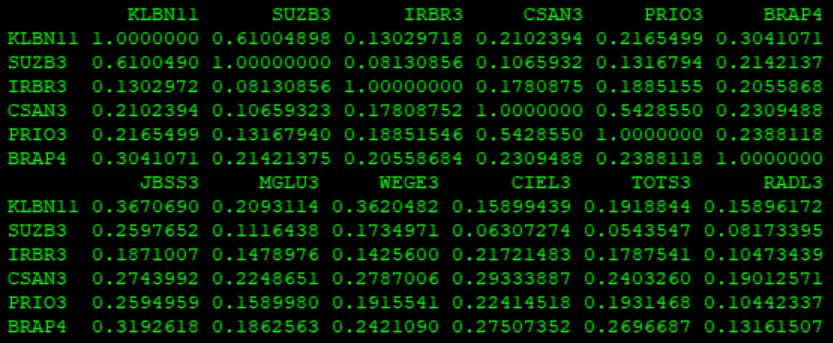
cormat <- cor(returnsT)
head(cormat)
# Get UPPER triangle of the correlation matrix
get_upper_tri <- function(cormat){
    cormat[lower.tri(cormat)] <- NA
    return(cormat)
}

# Use correlation between variables as distance
reorder_cormat <- function(cormat){
    dd <- as.dist((1-cormat)/2)
    hc <- hclust(dd)
    cormat <-cormat[hc$order, hc$order]
}

# Reorder the correlation matrix
cormat <- reorder_cormat(cormat)
upper_tri <- get_upper_tri(cormat)

# Melt the correlation matrix
melted_cormat <- melt(upper_tri, na.rm = TRUE)

# Create a ggheatmap
ggheatmap <- ggplot(melted_cormat, aes(Var2, Var1, fill = value)) +
 geom_tile(color = "white") +
 scale_fill_gradient2(low = "blue", high = "red", mid = "white",
    midpoint = 0, limit = c(-1,1), space = "Lab",
    name="Pearson\nCorrelation") +
 theme_minimal() + # minimal theme
 theme(axis.text.x = element_text(angle = 45, vjust = 1,
    size = 12, hjust = 1)) +
 coord_fixed()
Defina o local onde você deseja salvar a imagem (escolhi o formato pdf).
setwd("C:\\Users\\...")
width = 16
height = 16

ggsave(filename = "Heatmap_IBOV.pdf", ggheatmap, width = width, height = height, device='pdf', dpi=700)
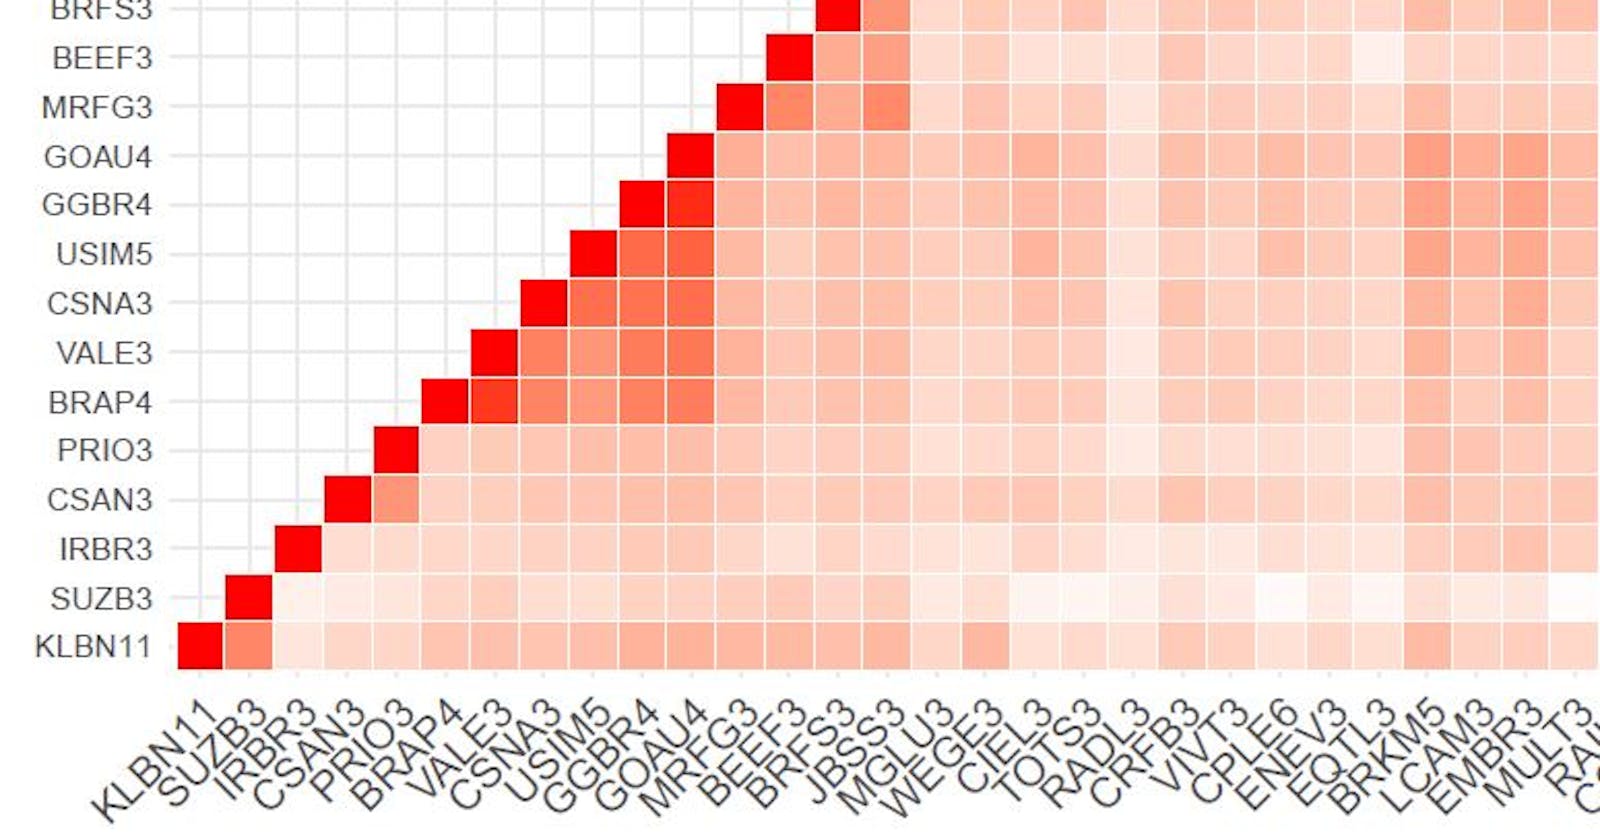
O resultado deve ficar parecido com o (pedaço) da imagem abaixo.
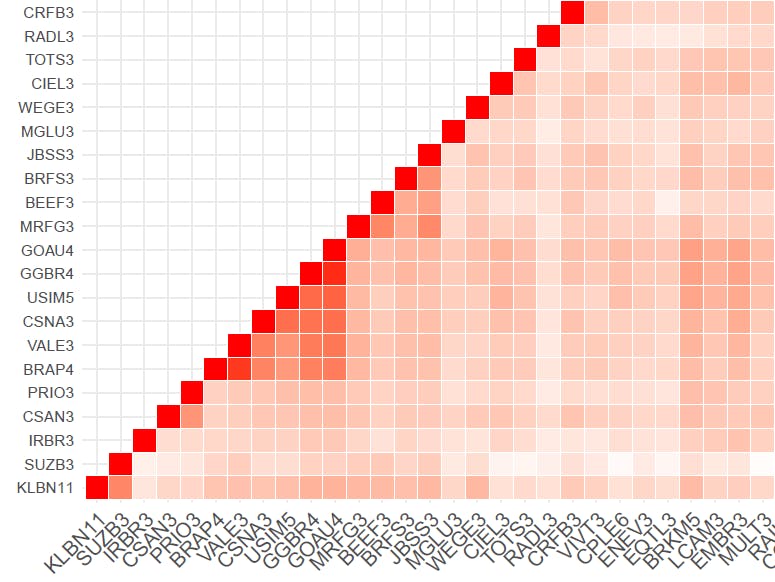
Veja a imagem completa no meu Github.
Até a próxima!